
True knowledge management requires the ability to monitor and use data and indicators related to the core activities of the organization. Embedded Power BI reports represent the tip of the data management iceberg, where the most relevant information from a large mass of data is crystallized into user-friendly, multi-purpose, low-threshold viewable format. By allowing users to view reports directly from the application they use as part of their daily work, it is easier to make full use of the gathered information.
When a finance manager, a maintenance technician or a nurse, for example, is looking for information that is essential for their work, it does matter in which medium and in which format the information is presented to them. Good access to information saves time and motivates people to use information regularly and efficiently. However, one reporting solution does not suit all, and the choice of tool should take into account, among other things, the characteristics and job description of the users, the use of the reports, and the frequency of information needs.
In the popular Embedded Power BI implementation model, reports are generated using Microsoft’s Power BI tool and embedded directly into the application’s user interface. This allows you to take advantage of Power BI’s advanced reporting architecture, while presenting the compiled data in a user-friendly interface. Power BI’s popularity is reflected in the fact that in 2022, research company Gartner named Power BI the market-leading BI solution for the fifteenth consecutive year. (Source: 2022 Gartner® Magic Quadrant™ for Analytics and Business Intelligence Platforms)
It is often most convenient to look at data that require further review and refinement in the BI tool’s report view, but it is worth having key figures that are relevant to your field of work conveniently available at all times – this way you can also monitor them regularly alongside your work. Depending on the sector, such data may relate to, for example pandemic reporting, learning analytics or site monitoring.
The versatile possibilities of Embedded Power BI reports
The information monitored from reports implemented using the Embedded Power BI model varies across industries, but they often involve tracking certain key trends and examining the impact of developments and other changes. For example, in manufacturing, the productivity of different production facilities can be monitored, in the public sector the number of users of services and changes in these, in the energy industry, for example, resource efficiency.
Let’s take the manufacturing industry, for example, and more specifically, maintenance. In this context, users of the reports can be roughly divided into three categories, each of which follows the reports in their own way and from their own point of view:
- Service technicians use the reports to guide and support their daily work, and they use the reports to monitor, for example, their own performance against set targets.
- Management often monitors the performance of maintenance through a few key performance indicators and larger trends – at a level similar to other areas of the business.
- Technical developers monitor the life cycle of machinery and equipment, assess investment needs and develop maintenance methods, among other things.
For service technicians, the ability to follow reports directly from a mobile app is often particularly useful. By making it as convenient as possible to log and monitor data in one application while working, it’s easy to keep the focus on practical maintenance tasks. Unlike managers and technical developers, the work of a maintenance engineer is mobile, and therefore browsing multiple systems alongside their main job puts unnecessary strain on their daily lives.
For example, knowledge management enabled by a combination of a maintenance system and a specialized BI tool opens up a wide range of reporting possibilities. Some users can use reports embedded in applications, others can view more detailed data and background information on figures in the BI tool’s report view, and others can use reports implemented in different ways and tailored to their specific use in other systems and applications.
Reports embedded in applications are the tip of the iceberg of efficient data management
Before maintenance engineers can see, for example, completed, pending and future maintenance activities directly on the screen of their mobile devices in the maintenance app, a wide range of technical preparations and methodological decisions have been made in the background. Regardless of the sector, the logic for implementing embedded reports is the same everywhere.
From an methodological point of view, the organization first has to understand the importance of effective reporting in daily work and business management. Secondly, it has to decide to make the reports as easy to use as possible for the users, that benefit from the reports embedded in the application, and thus Embedded Power BI can be chosen as the implementation method.
From a technical point of view, the preparations involve collecting, compiling, modelling and transforming data into a usable format. Once the desired data are in a reportable format, it is time to decide which reports are relevant for each target group, allocate access rights accordingly, and prepare an easy-to-use, visual appearance for the reports. Finally, the reports are embedded in the user’s application using Embedded Power BI so that they are easily accessible and viewable during the daily workflow.
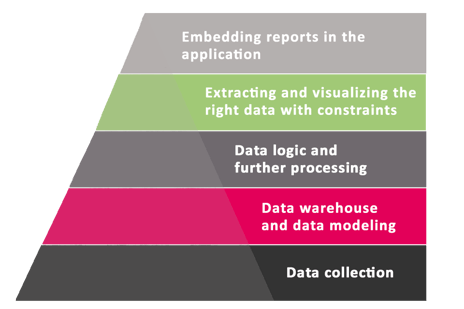
Embedded Power BI reports are the tip of the iceberg.
While embedded reports represent a kind of pinnacle of reporting development, not everyone needs to go all the way to the top of the iceberg. In many cases, it is sufficient to look at the data in an ERP, Power BI’s own or another standalone reporting service, or even in customized report views produced with software development. The reporting solution offered to the user should be considered first and foremost according to the reports’ target group, usage situation and frequency of use.
Read more
When paths diverge – transfer software development to a new partner in a controlled manner
When can and should software development be outsourced?
How will your company’s BI tool compare to the core capabilities listed by Gartner in 2022?
User-centric reporting is an effective way to communicate
Towards working with information – why and how?
Maintenance metrics as a tool for knowledge-based management